Pets are a source of joy and companionship for millions of households around the globe.
I will make it easy for you to explore the stats, such as how many pets there are, which ones are the most popular, and how pet insurance helps protect our furry friends.
Whether you already have a pet or are considering getting one, this guide will provide you with a foundation for exploring the fascinating statistics and insights that follow.
Lets Find Facts And Figures About Pet Ownership And Insurance.
| Statistic | Data |
|---|---|
| Percentage of U.S. households owning a pet (2024) | 66% |
| Number of pet-owning households in the U.S. (2024) | 86.9 million |
| Dog ownership households | 65.1 million |
| Cat ownership households | 46.5 million |
| Freshwater fish ownership households | 11.1 million |
| Total pet spending in the U.S. | $136.8 billion |
| Millennial pet ownership | 33% |
| Gen X pet ownership | 25% |
| Baby Boomer pet ownership | 24% |
| Pets insured in the U.S. | 4.8 million |
| Average monthly pet insurance premium for dogs | $44 |
| Average monthly pet insurance premium for cats | $30 |
| Pet ownership increase from 1988 to 2024 | From 56% to 66% |
| State with highest percentage of pet-owning households | Wyoming (72%) |
| State with the highest number of dog-owning households | California (5,576,000) |
| State with highest per capita dog ownership | Idaho (58%) |
| State with highest cat adoption per capita | Vermont (45%) |
Pet Ownership In The U.S
Sources: Pexels
Pet ownership in the U.S. has become an integral part of the American lifestyle, showing a significant increase over the past decades. As of 2024, 66% of U.S. households, which translates to about 86.9 million homes, have at least one pet.
This represents a notable rise from 56% in 1988, reflecting how pets have become increasingly central to American families.
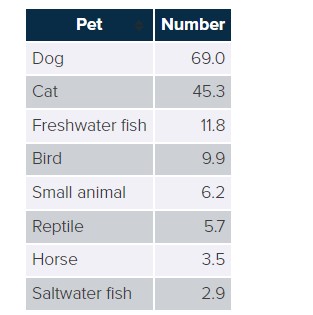
Dogs lead the popularity contest, with 65.1 million households owning a dog, followed by cats in 46.5 million homes and freshwater fish in 11.1 million homes.
This surge in pet ownership coincides with a broader understanding and appreciation of the roles pets play in providing companionship, emotional support, and even health benefits to their owners.
Consequently, the financial commitment to pets has also risen, with Americans spending a staggering $136.8 billion on their pets in 2022, a significant jump from the previous year.
In the United States, overall pet sector expenditures reached $103 billion, up by 6.7% from $97.1 billion in 2019. According to the APPA, spending in 2021 will total $109.6 billion.

This spending encompasses a wide range of expenses, including food, veterinary care, toys, and, increasingly, pet insurance.
The demographics of pet ownership have also evolved, with millennials now representing the largest segment of pet owners at 33%, followed by Gen X and Baby Boomers.
This shift underscores the changing attitudes towards pets, with younger generations viewing them more as family members than as mere companions.
Approximately 90.5 million families in the U.S. are pet owners, according to the American Pet Products Association’s 2021-2022 National Pet Owners Survey (APPA).
Pet Ownership by Generation
According to a survey done by APPA, pet ownership varies across different generations. The survey found that millennials own more pets than any other generation, at 32%.
Around 25% of Gen X and Baby Boomers own pets, while only 14% of Gen Z reported owning a pet. Builders, who are also known as the Silent Generation and were born before 1945, account for only 3% of pet owners in the U.S.
Pet Ownership Statistics
Sources: Pexels
- 66% of U.S. households, or 86.9 million homes, owned a pet in 2024.
- Pet ownership in the U.S. increased from 56% in 1988 to 66% in 2024.
- Dogs are the most popular pet, with 65.1 million U.S. households owning a dog, followed by cats (46.5 million households), and freshwater fish (11.1 million households).
- Millennials are the largest group of pet owners, making up 33% of the total, followed by Gen X (25%) and Baby Boomers (24%).
- In 2022, Americans spent $136.8 billion on their pets, up from $123.6 billion in 2021.
- The average annual cost for essential dog expenses is $1,533.
FAQs
🐶 What kind of food is best for my pet?
The best food depends on your pet's species, age, size, and health. It's important to choose a balanced diet suitable for their specific needs. Consulting with a vet is a great way to start.
🏥 Why is pet insurance important?
Pet insurance helps cover the cost of veterinary care if your pet gets sick or injured, ensuring they get the necessary treatment without putting a strain on your finances.
📊 How many households own pets?
As of the latest surveys, about 67% of U.S. households, or around 85 million families, have a pet. This shows how much people love having pets as part of their families.
📈 What's the average cost of pet insurance for dogs and cats?
On average, dog owners can expect to pay around $30 to $50 per month for pet insurance, while cat owners might pay between $15 and $30. These costs vary by coverage type and pet specifics.
🌍 Which country has the highest rate of pet insurance?
Sweden has the highest rate of pet insurance, with around 40% of pets insured. This high rate reflects a strong culture of pet care and welfare.
👀 What future trends are expected for the pet insurance industry?
Experts predict continued growth, with advancements in veterinary medicine and rising vet costs driving more pet owners to seek insurance coverage for their pets.
Quick Links:
- Social Media Statistics
- Instagram Statistics
- Blogging Statistics
- Pinterest Statistics
- Fascinating Online Shopping Statistics
- E-Learning Stats and Trends
Conclusion: Pet Ownership And Insurance 2025
Pets are frequently viewed as family members, and their health is extremely important to both them & their guardians.
Learning about pet ownership and insurance shows us how much we love our pets and want to keep them healthy. Even though lots of people have pets, not many have insurance for them.
This means there’s a big chance to make sure our furry friends are covered if they get sick. Pet insurance can help us not worry about vet bills and focus on what’s important: taking good care of our pets. It’s a smart choice for keeping our pets happy and safe!
For further information, look at all of the pet insurance companies.
Source: Naphia, Forbes, USnews, abc.net.au, Americanpetproducts, iii.org


