Not sure if Klipfolio vs Supermetric vs Tableau is suitable for your business?
Klipfolio, Supermetrics, and Tableau are all extremely useful and powerful Business Intelligence and data visualization tools. They help you with gathering better analytics for your business and automate data reports from a plethora of marketing channels. Be it Facebook, LinkedIn, Instagram,Mailchimp, Google analytics to anything. The obsolete method of storing all your data on spreadsheets and excels is no longer useful.
It is next to impossible for people to manually sit and analyze huge datasets and drive their business in the right direction. Imagine a single tool accumulating all the data in a single place and then giving you a comparative report analysis. It will take some time to get used to this software, their working, and terminologies, but with the time you won’t be able to function without them.
All you budding social media enthusiasts, digital marketers, growth hackers, and entrepreneurs must utilize the gold mine the internet has created for you via these tools. All your marketing campaign platforms get integrated with these BI tools. This will help you get a better idea of your business ROI, the trends existing in the market, how you should segment your data, and target the right audience.
Klipfolio Vs Supermetric Vs Tableau 2024 | The Ultimate Comparison
Overview Of Klipfolio
Klipfolio is a Canadian software company that came into existence in 2001. Their main focus initially was on the consumer market, which later moved to dashboard and business intelligence aspects. If you are looking for a one-stop solution to all your business needs when it comes to dashboards, Klipfolio is what you need. If you are someone who is result-oriented and wants to measure their business analytics effectively, just go ahead.
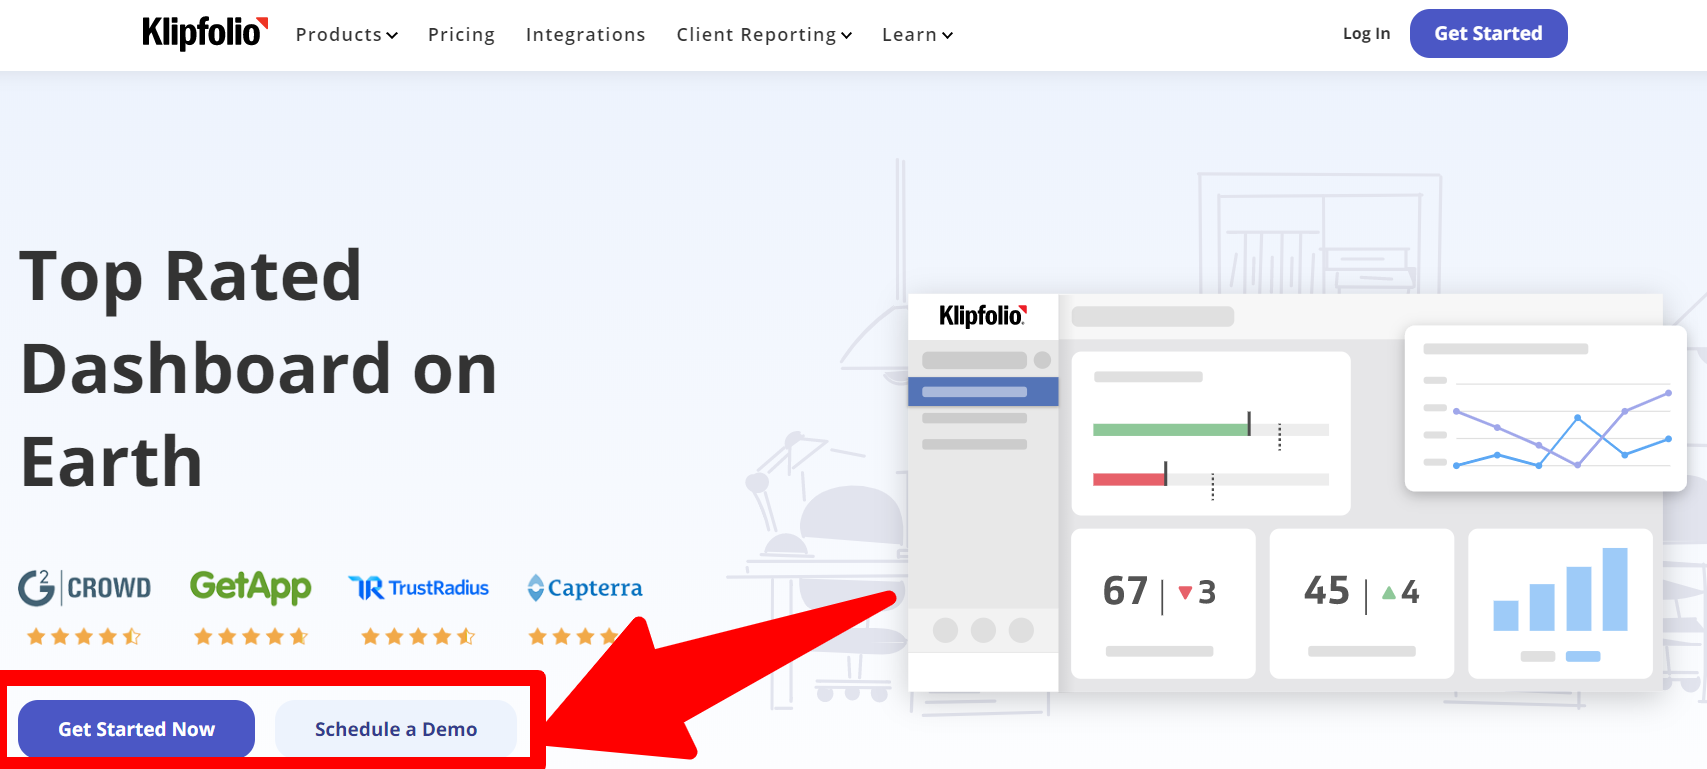
Klipfolio brings focus, agility, and confidence in your work. Personalizing dashboards to cater to the needs of different clients has never been simpler. It is trusted by over 50,000 people across the world. If you are unsure and want to test the true capabilities of Klipfolio, they have demo sessions in place for you as well. You can opt for a dashboard demo or attend their live workshops, where they cover all the aspects of Klipfolio.
They aim to help you utilize and analyze data for your business or venture effectively. They help you build real-time, live dashboards. Business users get to connect to various data services; they automate data retrieval and then use this data for visualizations after it has undergone manipulation.
Overview Of Supermetrics
Supermetrics provides you a single destination to handle all your business analytics needs. All in one place by leveraging the power of automation. Supermetrics is one such amazing tool. A full-fledged business reporting tool, which started in 2013 with the use of just Google analytics, and now it has integrated almost every other analytical and metric tool on its platform. Right from the time they started this platform, they have worked on improvising it in every which way possible. With every update, there was something new that they brought to the table. This has helped Supermetrics become one of the top players for BI automation in the market. This software collects data from a pool of sources, namely social media, online market sources, web analytics, etc. Then it processes all the information and provides you a unified solution. This is extremely essential when companies or businesses want to carry out comparative analysis and reinvent their strategies to reach out to a larger market segment.
The Google Drive integration in Supermetric allows you to run different queries, filter data, segment it, and share it with your teammates using tracking reports. Carrying out various marketing campaigns on different platforms is great, but analyzing them as separate data sources via the use of spreadsheets is a big no. Supermetric allows you to integrate about 12+ marketing channels, namely, Facebook, Youtube, Google ads, Google analytics, etc
The Uploader tool lets you leverage the costing and revenue data that is collected by running campaigns on various platforms. It helps you gain better insights so that you can run more productive campaigns the next time. Customized and more detailed reporting with formulation can also be extracted using Supermetric.
Overview Of Tableau
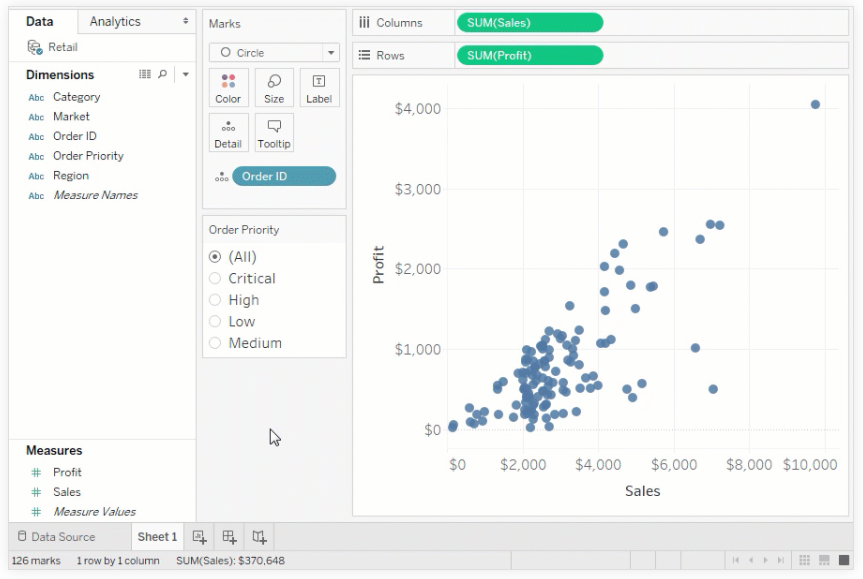
Founded in 2003, with its parent company being Salesforce, Tableau is an extremely powerful data visualization tool. It completely transforms the way people look at data and utilize it to solve problems. Tableau helps you convert raw and meaningless data into an analyzable and understandable format.
Tableau is undoubtedly the top player in the Business Intelligence and visualization tools. Even if you are someone who has a poor technical background, Tableau has built its features in such a user-friendly and handy way that you can easily manage to design your own properly customized dashboard and work on further business strategies.
Working Overview Of Klipfolio
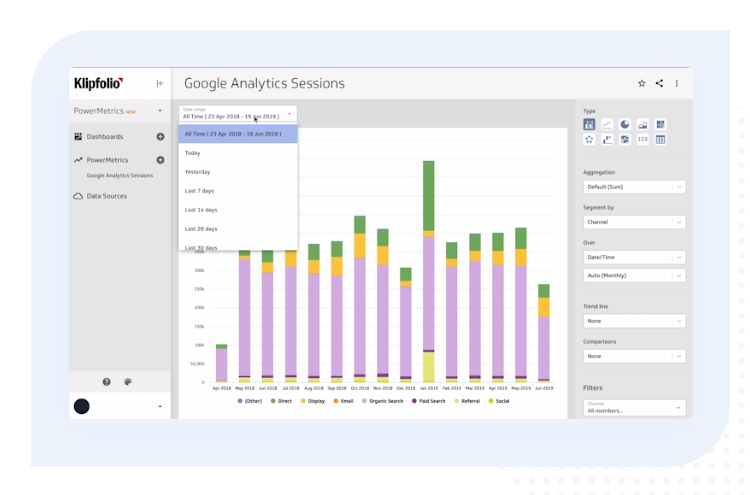
Klip is the widget of Klipfolio that helps you visualize data for your dashboard. You may use one or more Klip to view your data. It supports various data formats such as tables, charts, and gauges. It is made up of various attributes or components.
Components will define the way your klip will appear. Some of the components that you can use to build klips are:
- Image component
- Mini-chart component
- HTML template component
- Table component
- Line/bar graph component
- Pie chart component
- Value pair component and many more
The steps to building and working on Kilps are:
- Shortlist a component style
- Shortlist a source of data
- Allocate data to each sub-component
- Make changes in the properties as per your needs
- Save the klip and share it
Working Overview Supermetric
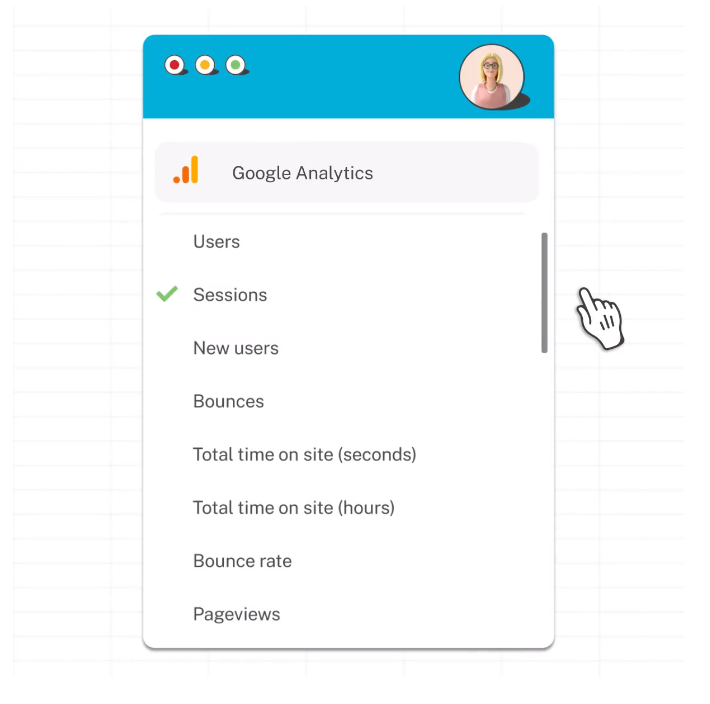
The Google Drive integration with Supermetrics helps you automate reporting in docs and google sheets. In simple words what it means is that you can transfer all the analytics reports from various marketing channels and view them on Google docs as a unified spreadsheet. Once all of these channels are refreshed, you are just one click away from getting insights into the most recent revenue figures that your business is making. The user interface of Supermetric is extremely engaging, user friendly, and attractive.
Just one look at the website and you will be bound to give it a try. This platform uses cloud computing for the various channel integrations that it provides. It has an auto-update feature which makes things simplified. Be it the excel reports which use the data grabber or be it analyzing the performance of your ad campaigns, to visualizing your data, supermetric has it all covered for you. As a matter of fact, it is used by five hundred thousand people across 13000+ companies worldwide and around 120+ countries.
Working of Tableau:
The ability of Tableau to create such interactive and creative dashboards and visualizations with instant connectivity features that support more than 3 types of data for sure secures the first position compared to its market competitors.
After it has simplified its User Interface(UI) the user base has increased far more. The time that people take to use it is far better and productivity has increased. Tableau also provides a learning course or training of sorts for its users to get a better hold of it. Online learning resources are easily accessible. Just head over to the official website of Tableau i.e. tableau.com and on the home page towards the left-hand side corner, you will find the learning panel and click on it. Tada, you are ready to view all the learning content put up on their website.
The major features of Tableau are:
- Affective translations of visualizations
- Any kind of data can be imported
- Interactive and creative dashboards
- Toggle view options
- Great security is ensured
- Data filtering and data highlighting
- Facility to share dashboards and dashboard notifications
- Data visualizations
- Automatic updates available in the software
The most powerful function of tableau is indeed its ability to collect and extract data from a plethora of platforms and store it in an understandable and usable way at one destination. Then you can collect the data from Tableau’s data engine. Later on, the engine will analyze the data and create the respective visualizations.
These custom-designed data reports or sheets are shared as static files to the working users. The users will then modify these worksheets to analyze this file in the tableau reader tool. Now tableau’s servers can issue the data to Tableau’s desktop. This allows users a smooth and simple experience, managing files from any place in the world. It could be from desktops, mobiles, tablets, etc.
Klipfolio Integrates with:
- Excel
- Dropbox
- Facebook and Facebook Ads
- FTP/SFTP
- Flurry
- Google Adwords
- Google calendar
- Google drive
- GitHub
- Google Analytics
- Hubspot
- LinkedIn and LinkedIn Ads
- Mailchimp
- MongoDB
- MySQL
- Onedrive
- Oracle
- RSS feed and many more
Supermetric Integrates With:
- Google Analytics
- Google Adwords
- Database
- MailChimp
- BingAds
- Google Search Console
- Facebook Insights
- Moz
- Stripe
- Yahoo Gemini
- Adobe Analytics
- DoubleClick
- Adform
- Youtube
- Twitter Ads
- SEMRush
- Facebook Ads
- Google BigQuery
Pros and Cons: Klipfolio Vs Supermetric Vs Tableau
Pros: Klipfolio
- Data Analytics and Visualization in one tool
- Sophisticated Formulas to visualize complex data
- Sharing dashboards with your team across multiple channels
- Options to display dashboards on TV’s
- Share reports on slack, email, use links or snapshots
- Pre-built templates and Klips
- Schema-less architecture helps non-technical end-users connect to data, reuse it on the platform, and then visualize it effectively.
- Access to dashboards via phones, desktops, tablets, etc in addition to TV’s
- Presence of applied reporting actions such as grouping, filtering, sorting, etc
- Metric HQ to evaluate data based on popular metric and integrated metric services.
Cons:
- Lack of timelined quarterly data
- Lack of better data filtering options
- Sharing within the team becomes clunky because of password protection. There should be features to only enable it for public sharing.
- Only one line bar can be displayed on the chart at once. This makes it difficult when you want to analyze multiple factors affecting something common.
- The UI is not as friendly on IOS as it is on android. The ease of use is less.
Pros: Supermetrics
- The one-stop spot for data mining and data visualization via the Data Studio
- Offers Search engine marketing tools
- Auto-updating facility and extraction of comparative analysis reports
- Well presented and structured data visualization.
- Integration with Google Adwords and other media channels
- No need to purchase the upgraded software as they allow you to use dedicated tools as per your business needs
- the facility of a 14-day free trial
Cons:
- It is not supported on phones and they do not have chat support for the software
- Leading global MNCs are not utilizing this software
- Compared to its competitors, it has very few features in business intelligence.
- Supermetrics does not have a proper mechanism to correct errors in the data and consumes a lot of time
- No quote payments are offered.
Pros of Tableau:
- It is very safe and secure to use even when handling billions of rows of data
- In one go a variety of data visualizations can be created.
- Tableau is available on mobile phones and desktops offering the same features so that you can work on the go.
- Tableau has its community for support and user queries. They are fast and efficient.
- The facility of a 14-day free trial
Cons of Tableau:
- Revision history is provided only for the recent versions. This is a setback and older versions cannot be rolled back
- Updating of data in the reports is not automated and is very tedious
- once your reports or dashboards are published, it is not possible to recover the data.
- For creating a high-end complex dashboard, you cannot just rely on the software. Basic knowledge of SQL is needed.
Comparative analysis of Klipfolio, Supermetric, and Tableau in different domains:
Pricing
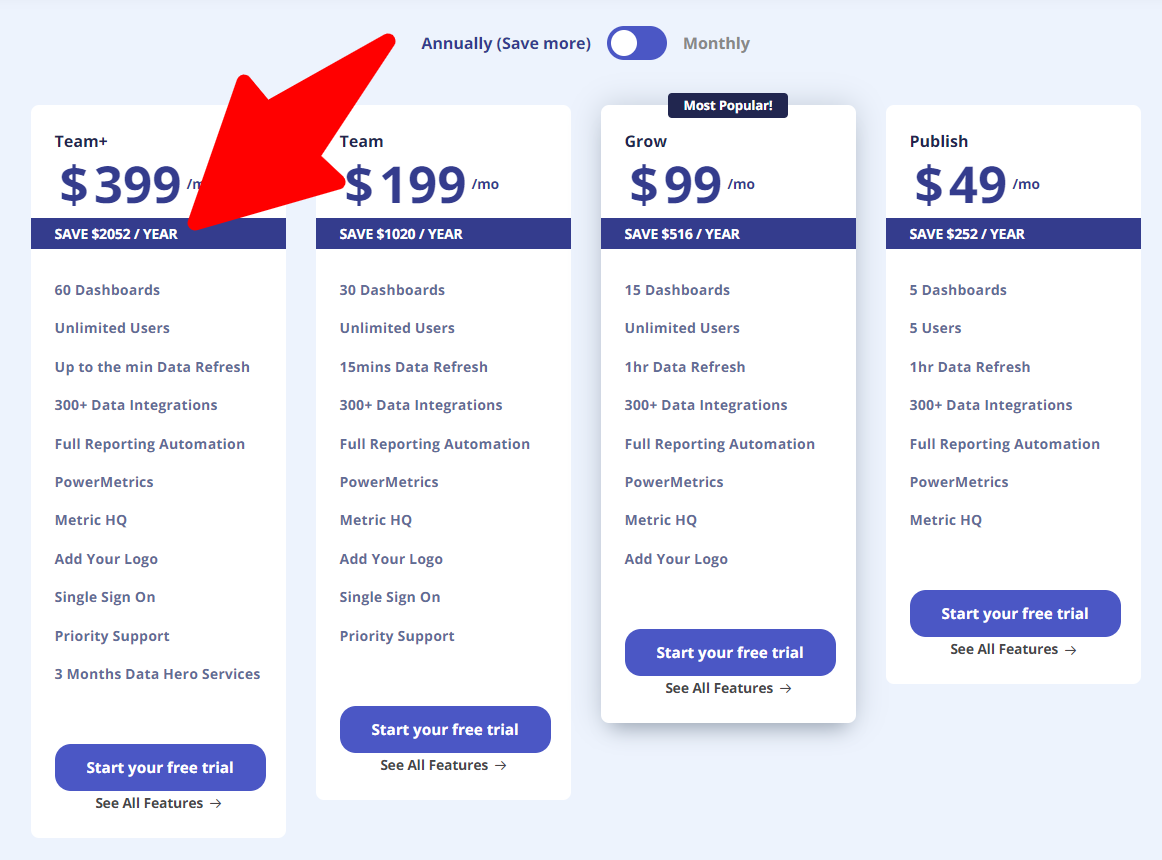
- Klipfolio has 4 broad monthly plans and yearly plans as well, where you can save more. The price of the four plans is :$399/ month,$199/month,$99/month, and $49/ month. Mind you these are the yearly plan prices. Make an informed decision and then proceed forward.
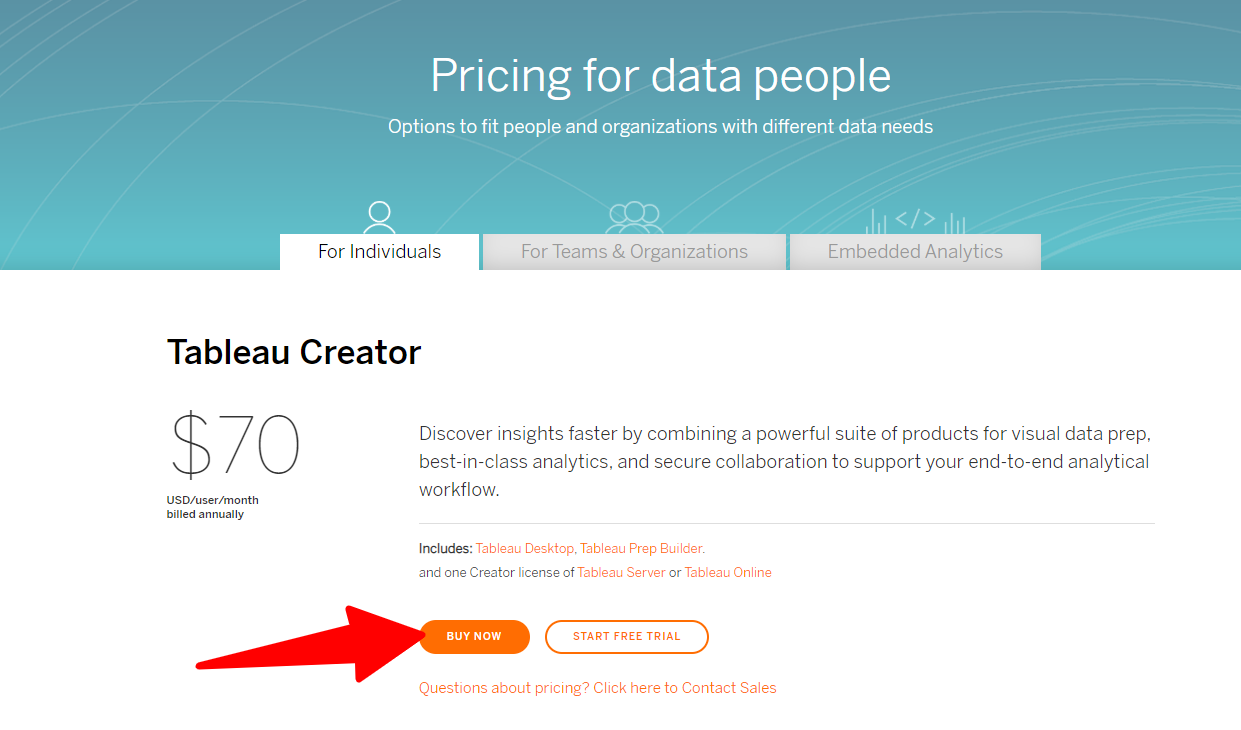
- For Tableau, the pricing of their services starts from $35 per month to $999 per year for Personal Desktop.
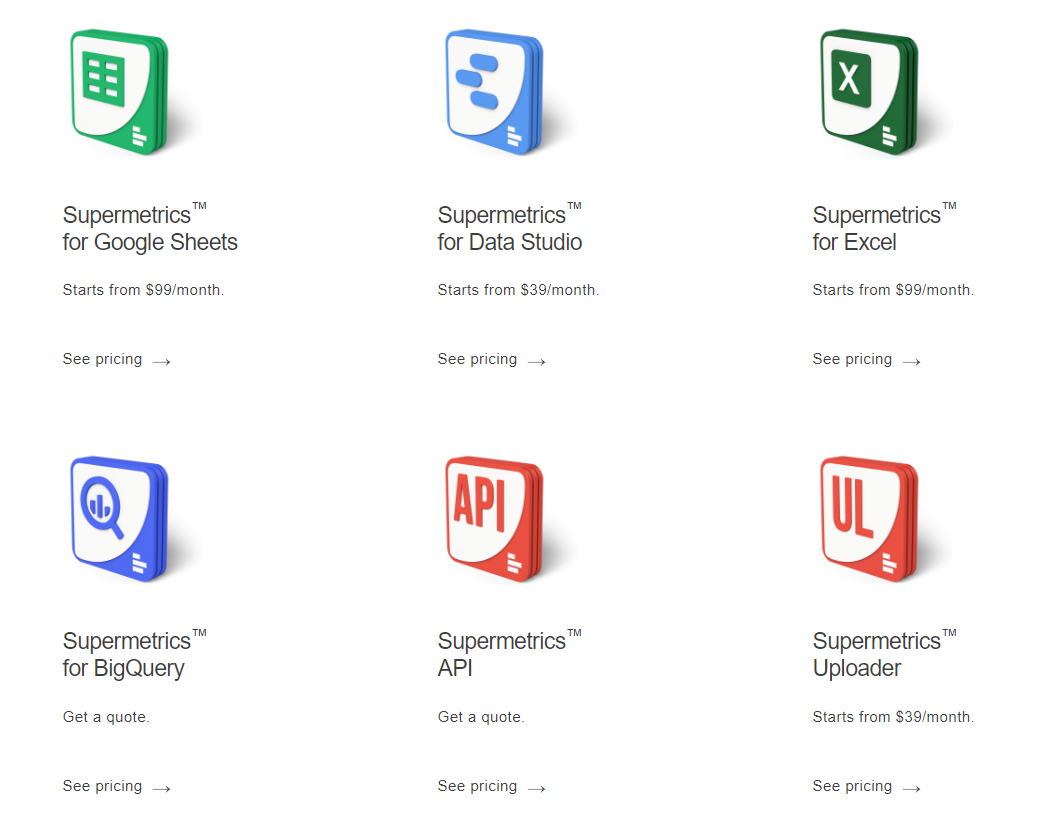
- For Supermetrics, the price of their services is starting from $39 to $299 per month. Supermetrics is by far the cheapest option you will find in the market amongst its competitors. With just 19$ a month, they offer plans in an add-on typology. Purchase the basic plan with the least price and then pay for any add-on tools that you want to include.
Integration Software
- Klipfolio has a wide array of integrations available. They have about 100+ integrations available with their platform.
- Supermetric, on the other hand, offers way less integrated tools but with high user-friendliness and accuracy. It supports 60+ connectors.
- Tableau supports nearly 50+ integrations on its platforms
Catering Audience:
- Klipfolio is good for new-age businesses, start-ups, or small companies. It is relatively quite expensive and hence does not have a huge audience base.
- Supermetrics is best for start-ups, digital marketing agencies, e-commerce companies and those companies which are extremely focused on digital aspects of marketing
- . Tableau leads the game when we talk about data visualization and business intelligence. It is being used in many companies as a data analytics tool and is gaining momentum.
Languages Supported:
- Klipfolio provides no variety when it comes to languages. As of 2020, they have only English as a supported language.
- Supermetrics also restricts itself to only English as of now.
- Tableau on the other hand leads and provides multi-language support. The supported languages are English, Chinese, German, Japanese, Spanish, French, and Portuguese.
Klipfolio Vs Supermetric Vs Tableau & FAQs
👉🏻 What are the top competitors of these three tools?
Adversity, Looker, Act-On, Hubspot Marketing Hub, Segment, Adobe Analytics are some of the frequently used alternatives to the above-mentioned tools. Although they are very different when it comes to pricing and the data sources that they utilize. The instructiveness and user interface are also very different.
👉🏻 Integrating other marketing channels with such tools is safe?
To be 100% sure, it is best to check out the soft wares TOC page and read their privacy policy. In any case, these tools only store your data temporarily on their servers, these online tools do not save your data permanently on their servers. Once your reports or dashboards are built, they delete the saved data. Even if they use your cached data for better search results, it is encrypted and safe.
👉🏻Do we have free options or a trial period or discount coupons for these types of software?
If you are one of those people who had very high hopes, then please lower them. There are no free alternatives to these software. At most, they have free trial versions of nearly half a month. That too is an amazing marketing strategy. They grab your attention, get you addicted to the software in that frame time, and then indirectly cause you to subscribe to the paid version. Coming to any coupon codes or discounts, they are also not provided by any of these tools. Although Klipfolio gives you free demos, workshops, and courses other than the other features.
Klipfolio Vs Supermetric Vs Tableau: Testimonials & Reviews
Klipfolio Review
Supermetric
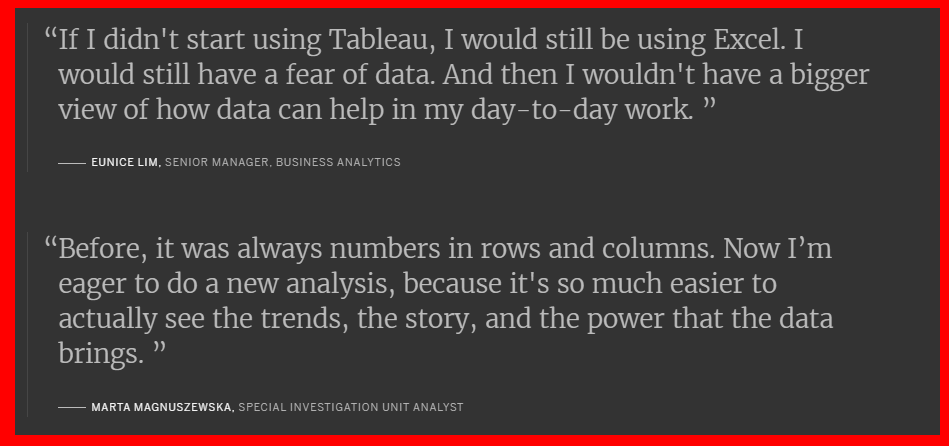
Tableau Review
Quick Links:
- Improvado Review 2024: Is It Legitimate Tool ? Read Before Buy( 8 Stars)
- DataHawk Review 2024: Is It Best Amazon Analytics Tool? (Pros &Cons)
Conclusion: Klipfolio Vs Supermetric Vs Tableau 2024 |
In the end, I can say that Klipfolio is the perfect blend of functionality and pricing. You are able to create some very amazing metrics along with visuals with this program. Supermetrics offers some amazing features but it can take some time to learn the software and get hands-on practice on it.
Tableau is an excellent program that provides automated reports which can be published easily. Also, with this program the visuals created are amazing. My most favorite feature of this program is the alert and subscription system. Also, the customer service of Tableau is the best amongst Klipfolio and Supermetrics as this program offers in-person support which is missing in the other two.

