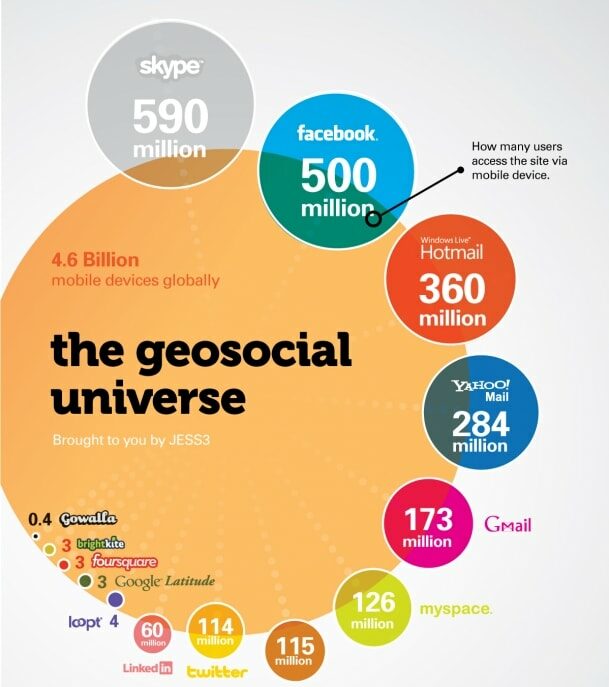
The landscape of the internet is constantly changing, which means that the statistics relating to internet usage can vary from year to year.
Nevertheless, the world of the internet has an endless supply of fascinating facts and figures to explore.
From the vast number of people who are connected online to the immense amount of data that is exchanged every second, internet usage continues to shape our daily lives in remarkable ways.
You can discover insights into how many people use the internet, what online activities are popular, and the growth of digital technologies.
| Statistic | Value (2024) |
|---|---|
| Total Internet Users | 5.35 billion |
| Internet Penetration Rate | 66.2% of the world’s total population |
| Year-on-Year User Growth | 97 million new users |
| Growth Rate | 1.8% annual growth |
| Unconnected Population | 2.74 billion people remain unconnected |
| Mobile Internet Usage | 96.5% of internet users access the web via mobile |
| Mobile’s Share of Online Time | 57.6% |
| Web Traffic from Mobile | 58% |
| Social Media Users | 5.04 billion |
| Social Media Penetration | 62.3% of the global population |
| Social Media User Growth Rate | 5.6% year-on-year |
| New Social Media Users (2023-2024) | 266 million |
| Unique Mobile Users | 5.61 billion |
| Smartphone Connections | Almost 7 billion smartphones are in use |
| Smartphones as a Percentage of Mobile Phones | 85% |
| E-commerce Weekly Shoppers | 56.1% of internet users aged 16 to 64 |
| Online Consumer Goods Purchases in 2023 | US $3.15 trillion |
| Average Annual Online Spend per Shopper | More than US $1,000 on consumer goods |
Internet Statistics For 2025
Source: Pexels
1. The world’s population is 7.83 billion people. 4.66 billion of them seem to be active Internet users, according to Worldometer. (Statista)
2. By continent/region, Asia has the highest percentage of Internet users. Of all those who use the Internet:
- Asia accounts for 51.8 percent of the total.
- 14.8 percent of the population lives in Europe.
- Africa accounts for 12.8 percent of the total.
- The Caribbean and Latin America account for 9.5 percent of the total.
- 6.8% of the population lives in North America.
- The Middle East accounts for 3.7 percent of the total.
- Oceania and Australia account for 0.6 percent of the total.
3. Kuwait has the highest Internet penetration rate in the world, at 99.6 percent.
4. With 284 million Internet users, the United States is the third-largest country in terms of Internet users.
5. One of the most fascinating Internet truths for me is that people of all ages utilize the World Wide Web in the United States. Younger users, on the other hand, are more likely to be online:
- 100 percent of 18 to 29-year-olds.
- 97 percent of 30 to 49-year-olds.
- 88 percent of people aged from 50 to 64.
- 73 percent of those aged 65 and over
6. The Chrome browser is accessed more than any other browser by people (63.54 percent).
7. Android devices have 38.83 percent more Internet users than any other smartphone or PC device.
8. On a daily basis, the typical online consumer spends 6 hours and minutes online.
9. There is 6.59 billion GB of Web traffic per second of the day.
10. The average download speed on the Internet is 24.8 Mbps.
11. As of January 2024, 66.2% of the global population, or 5.35 billion people, were internet users, with 5.04 billion being social media users.
12. 5.35 billion people around the world were using the internet at the start of 2024, equivalent to 66.2 percent of the world’s total population.
13. The world’s connected population grew by 97 million users in the 12 months leading up to January 2024.
14. The year-on-year growth rate for internet users was 1.8 percent in 2024, indicating a steady increase in global internet adoption.
Domain Name Stats
- In 1985, symbolics.com was registered as the first domain name.
- Voice.com, which was sold for $30 million, was the most premium domain name ever sold.
- There are 370.7 million domain names registered.
- With 150.3 million registrations, it is the most common top-level domain.
- There are 160.6 million country-code TLDs registered in total.
- ICU is the fastest-growing generic top-level domain (gTLD), with 4,337,102 registered domains.
Stats and Facts on Web Hosting and Websites
1. The first website created by Tim Berners-Lee was created at info.cern.ch, and they established the first web server (named CERN HTTPd)
2. The following are the top three web hosting companies:
- Amazon
- Endurance Group is a company that specializes in endurance sports (parent company of Bluehost, Hostgator & more)
- GoDaddy
3. The United States has far greater web servers than any other nation, accounting for 39.7% of all online servers. (W3Techs)
4. There are 1.82 bn web pages on the internet. (Statistics from the Internet)
5. HTTPS is used by 68.2 percent of all websites.
6. HTTP/2 is used by 49.6 percent of all websites.
The top three languages used on internet sites are:
- 60.5 percent use English.
- 8.6 percent Russian
- 4.0 percent in Spanish
7. A website’s average transfer size is:
Mobile: 1,891.6 KB & Desktop: 2,062.4 KB (HTTP Archive)
8. It typically takes 9.3 seconds for a smartphone website to load (until interactive).
9. If a website on a smartphone takes longer than 10 seconds to load, users are 123 percent more likely to abandon it (as opposed to a second). (Consider Google)
10. WordPress is the most popular content management system, accounting for 63.9 percent of all websites and 39.3 percent of all websites produced.
Facts of E-Commerce
1. In 2021, 2.14 billion individuals are expected to purchase online.
2. Online purchases account for 59.47% of all purchases.
3. Mobile devices accounted for 31% of internet sales in Q2 2020.
4. In 2021, global retail eCommerce sales are expected to exceed $4.88 trillion.
5. In 2022, retail eCommerce sales are expected to reach USD 6.54 trillion.
6. In 2019, Amazon solely sold $275.86 billion in items. Marketplace sellers contributed $160 billion.
7. Consumers in the United States used facts from e-commerce sites to guide their retail purchasing experiences in 64.83 percent of cases.
8. The average value of an online order varies by device:
- $179.98 on a desktop, $87.01 on a tablet, and $79.33 on a smartphone
- $70.95 (other) (grow code)
9. Free delivery is the most important criterion for 50 percent of buyers when selecting whether or not to buy something.
10. 56.1 percent of internet users aged 16 to 64 buy something online every week.
11. The amount of money spent on online consumer goods purchases in 2023 reached US$3.15 trillion.
12. The average ecommerce shopper around the world spends more than US$1,000 per year on online purchases of consumer goods.
Stats on Social Media
Image Credit: wikimedia.org
1. Around the world, there are 4.14 billion active social media users.
2. Consumers use social networking and messaging applications for approximately 2 hours and 24 minutes every day.
3. The three most prominent social media & messaging apps (in millions) are:
- With 2,701,000 users, Facebook is the most popular social media platform.
- YouTube has a user base of 2,000,000 people.
- WhatsApp has a user base of 2,000,000 people.
4. Despite the fact that most social media consumers are on many networks, there is a generational disparity in how many they handle at any given time:
- With 8.1 accounts, millennials have the most.
- Baby Boomers have 4.6, Gen Z has 7.9 & Gen X has 6.3.
5. Every month, over 180 million companies utilize Facebook and its related properties (such as Instagram, Messenger, and others). (Facebook)
6. Every day, Facebook products send over a hundred billion messages and share a billion stories. (Facebook)
7. Users spend 73.7% of their time on YouTube on their mobile devices. (YouTube)
8. 74.6% of Instagram consumers have found new products through the platform. (Instagram)
9. Every day, almost 200 million Instagram consumers will view any one brand profile. (Instagram)
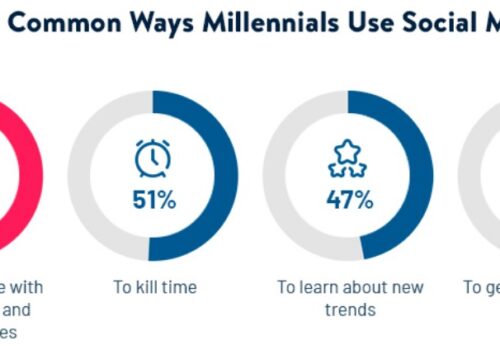
10. When it comes to purchasing, people most typically utilize social media in the following manner:
- Investigate products that they are interested in (43%)
- Advertisements can teach you about products and brands (27%)
- Obtain recommendations from their contacts (24%).
11. Seventy-seven percent of Americans have purchased something they saw on social media. (Mint)
12. When it comes to holiday shopping, 78.26% of people turn to social media for assistance. (Statista)
13. Over 95% of FB ad clicks are made on mobile devices.
14. The total number of active social media user “identities” reached 5.04 billion in January 2024.
15. This accounts for 62.3 percent of all the people on Earth, suggesting that 94.2 percent of internet users now use social media every month.
16. Social media user identities around the world increased by 266 million between January 2023 and January 2024.
FAQs
💻 What are the most popular online activities?
The most popular online activities include social media usage, video streaming, online shopping, web browsing, and accessing news and information.
📱 How many mobile internet users are there?
There are approximately 4.28 billion mobile internet users worldwide, representing a significant portion of total internet users.
💬 What are some emerging trends in internet usage?
Emerging trends in internet usage include the rise of mobile internet, increasing reliance on cloud services, growth of e-commerce, adoption of Internet of Things (IoT) devices, and expansion of online streaming services.
🚀 What technologies are driving internet growth?
Technologies driving internet growth include advancements in mobile networks (such as 5G), expansion of broadband infrastructure, development of satellite internet, and improvements in internet-enabled devices.
🌍 How does internet penetration vary by country?
Internet penetration varies by country, with some countries having high rates of internet adoption and connectivity, while others have lower rates due to factors such as infrastructure development, economic disparities, and government policies.
Quick Links:
- Most Important LinkedIn Stats
- Top Video Marketing Stats
- Social Network Usage Stats
- Millennial Marketing Statistics
- ChatGPT Statistics
- Uber Eats Statistics
- Spotify Statistics
- TikTok Statistics
Conclusion: Internet Statistics 2025
The statistics related to the internet offer an intriguing insight into the vast and ever-changing online world.
These insights help us to understand the enormous impact of the internet on our lives, from the number of users to the growth of digital content.
As technology continues to progress, our dependence on the internet for communication, information, and entertainment will also increase.
By staying aware of internet trends and patterns, we can better comprehend the evolving digital landscape and make use of its potential for innovation and connectivity in the future.
Sources: Worldometers, Statista, Internet World stats, Gs.statcounter, Weforum.org, Emarketer, Mint, GlobalWebIndex, W3Techs


