“Ecommerce Statistics 2025” provides insights into the world of online shopping through facts and figures. These statistics help us understand how online shopping has evolved over time.
Since the pandemic started, more people have been using their phones and computers to buy things like clothes, groceries, and furniture.
This shift happened because it’s more comfortable and convenient to shop online, and people’s shopping habits have changed a lot during this time.
These statistics help us see these changes and understand the growing trend of buying things online.
| Category | Detail |
|---|---|
| US Retail eCommerce Sales (2022) | Expected to increase by 16.1%, reaching $1.06 trillion |
| B2B Online Shopping (2022) | B2B eCommerce website sales are projected to reach $1.77 trillion, up 12% from the previous year |
| Amazon’s Market Share | Accounts for about 40% of all eCommerce sales in the US; sales are expected to grow by 15.3% to nearly $3.6 billion |
| Amazon’s Fastest-Growing Sector | Food and beverage sector with internet sales increasing over 25% YoY |
| Apparel and Accessory eCommerce Sales | Expected to stagnate in percentage of overall eCommerce sales in 2022 and 2023 |
| Popular eCommerce Categories | Books, music, and video (69.1% of total retail revenue); computer & consumer electronics (53.2% of total retail revenue) |
| eCommerce Forecast for 2024 | Global eCommerce sales are expected to exceed six trillion dollars |
| China’s eCommerce Growth (2022) | Projected to slow down to 13.0% due to a sluggish economy and focus on brick-and-mortar stores |
Ecommerce Statistics 2025
- Online Retail Purchases: 20.8% of retail purchases were online in 2023.
- E-commerce Sales Growth: E-commerce sales grew by 10.4% in 2023.
- Global E-commerce Market: The global e-commerce market totaled $6.3 trillion in 2023.
- U.S. E-commerce Market: The U.S. e-commerce market reached over $1.1 trillion in sales in 2023.
- Online Retail Purchases in the U.S.: 16.4% of retail purchases in the U.S. were online in 2023.
- Amazon’s Market Share: Amazon held 37.8% of e-commerce sales.
- Most Visited E-commerce Websites: Walmart, eBay, and AliExpress were the most popular e-commerce websites.
Social Media E-commerce Statistics
- Social Media Commerce Spending: $992 billion was spent on social media commerce in 2020.
- U.S. Social Media Shoppers: 96.9 million people in the United States shopped on social media platforms.
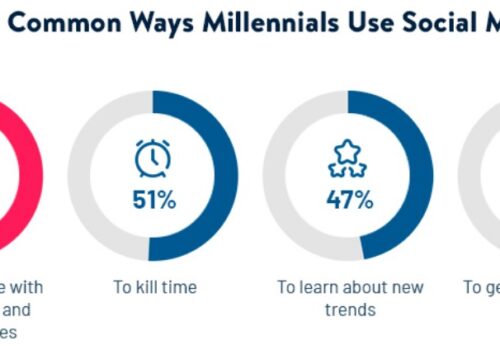
- Millennials’ Social Media Shopping: 55% of people aged 18 to 24 in the United States made purchases on social media.
- Social Commerce in China: Nearly 50% of online shoppers in China used social networks for purchases.
- Popular Social Media Platform for Commerce: Facebook was the most popular platform for online purchases.
- Social Media Influence on Purchases: 40% of purchases were influenced by social media; 49% were influenced by influencers’ recommendations.
Mobile E-commerce Statistics
- Smartphone Usage for Online Purchases: 91% of people use smartphones for online shopping.
- Mobile Commerce Sales: Mobile commerce sales accounted for 6% of all retail sales in 2023.
- Mobile Commerce Sales Growth: Mobile commerce sales were more than $360 billion in 2021 and grew significantly by 2025.
Stats on Ecommerce Sales
Throughout the next several years, tech-savvy consumers seeking rapid, frictionless purchase choices will continue to rely on eCommerce, & more consumers will join the bandwagon.
Retail eCommerce sales in the United States are expected to climb 16.1% in 2022, reaching $1.06 trillion.
Forecasts for business-to-business (B2B) online shopping in 2022 indicate continuous growth. During the pandemic, it appeared that every area of the company was either relocated or driven into a digital framework, particularly B2B communications.
Businesses may improve supplier & consumer management, reduce marketing costs & increase sales engagement by following emerging B2B eCommerce trends.
We estimate that B2B eCommerce website sales will reach $1.77 trillion in 2022, up 12% from the preceding year, as e-commerce trends play an increasingly important role in daily B2B operations.
Ecommerce Statistics on Amazon
Amazon’s clout in the online world is unrivaled. The e-tailer accounts for roughly 40% of all eCommerce sales in the United States. Its online sales in the United States will increase by 15.3 percent this year to nearly $3.6 billion.
Image credit: wikimedia
Food and beverage are expected to be Amazon’s fastest-growing sector this year, with internet sales up over 25% year over year (YoY). Amazon’s virtual grocery presence will continue to move the firm upward in the eCommerce market as it dominates the online grocery space.
eCommerce Forecast 2025
Ecommerce milestones will be reached sooner than predicted in the coming year. In 2022, we predict US e-commerce sales to surpass a trillion dollars for the first time. We did not expect e-commerce to achieve this milestone until 2024, prior to the pandemic.
Ecommerce sales are expected to exceed five trillion dollars in the year 2022 and six trillion dollars in the year 2024 globally, according to our estimates.
Image credit: pexels
Lastly, after ten years of phenomenal growth in internet shopping, China’s sales are projected to return to more typical levels in the future.
Due to a sluggish economy (particularly slower retail development) and a renewed concentration on brick-and-mortar, China’s eCommerce growth will decrease to 13.0 percent in 2022.
FAQs
🛍️ What percentage of retail purchases were made online in 2023?
In 2023, 20.8% of all retail purchases were made online. This significant portion reflects the growing trend of consumers preferring online shopping for its convenience and the wide variety of products available.
🌎 Which company has the highest market share in e-commerce?
Amazon dominated the e-commerce market, holding the highest market share with 37.8% of e-commerce sales. This dominance underscores Amazon's vast product range, efficient logistics, and strong customer loyalty.
🛒 Which are the most visited e-commerce websites?
The most visited e-commerce websites were Walmart, eBay, and AliExpress. These platforms attract millions of visitors due to their diverse product offerings, competitive pricing, and strong brand reputations.
🌐 How many people in the U.S. shop on social media platforms?
In the U.S., 96.9 million people engaged in shopping on social media platforms. This trend highlights the effectiveness of social media in influencing purchasing decisions and its role as a significant channel for online retail.
📱 What percentage of people use smartphones for online shopping?
A whopping 91% of people used their smartphones for online shopping. The convenience of mobile devices, coupled with improved mobile shopping experiences and apps, has made them a popular choice for making online purchases.
Quick Links:
- Top Video Marketing Stats You Should Know
- Social Network Usage Stats: How Many People Would Be Using Social Media?
- TikTok Statistics You Need To Know: How Do I Check My TikTok Stats?
- Amazing AR Statistics, Facts, and Trends To Consider
- Most Fascinating Oligarchs Statistics, Facts, and Figures: Top 3 Country
- Significant Reddit Statistics
Conclusion: Ecommerce Statistics 2025
I hope this article has helped you understand industry benchmarks and eCommerce growth.
If you are looking to open your own eCommerce store, then this is the best time to ride the wave as internet adoption will only grow upwards from here and as more and more people globally prefer to buy online.
Let us know your thoughts regarding this article in the comment section below.


